
I was recently listening to a podcast that started with stories about hacking into poker players’ machines and ended up with an interview with Mikko Hypponen of F-Secure about the history of malware. Mikko had a few interesting stories and talked about the evolution of malware, from the early days, when they received samples in the mail (on floppy discs! Yep those days), to more recent outbreaks and campaigns. What started with mostly harmless pieces of code, evolved into what we’re witnessing now; far too frequent attacks, with completely different motivations, and an increasingly sophisticated cybercrime and cyberwarfare landscape.
Listening to it, one question came to mind: how is the cybersecurity industry dealing with this evolution, is it keeping up, or is it constantly playing catch-up? I have my own idea, but thinking about it, the answer is not as straightforward as it might seem. Both sides are trying to innovate and to be creative in their own mission. Defenders are constantly updating methods and processes to stop or control threats, and on the other hand, attackers are constantly morphing and trying to find ways to deceive or bypass controls, find vulnerabilities or new ways to abuse services, and also live off the land. To an external observer, however, it certainly looks like the cybersecurity industry is having a hard time keeping up with cybercrime. And it absolutely is, to a certain extent.
I had mentioned in a previous post how cybercrime revenue was estimated to be more than 14 times bigger than the entire industry spent last year (2019). However, it’s not always about money (or is it? I’m not sure!). In any case, I wanted to see if basic data points, like IoC data from the daily evolution of the threat landscape, can show something useful there. What came to mind was this: from a detection point of view, look at a set of daily new threats (considering only file-based initially) and see the initial detection rates of existing protections, then monitor how those evolve over time. Essentially, this means, collect a set of daily new IoCs (hashes in this case) from a threat intelligence feed and put them through a multi-AV solution, and monitor results for a few days.
It’s worth noting that it is impossible to assess the ‘novelty’ of new threats from hashes and this is why collective performance might be a good indicator. All new IoCs might well be detected by some of the existing heuristics, signatures, or machine learning models. After all, these detections are meant to identify variants and even new and similar threats, exhibiting similar patterns or malicious behavior. It might also well be the case of detections that are too broad that they have low FN rates (maybe at the expense of high FP rates, but that’s a different story – for another time maybe). So to surface the most relevant threats, it’s not necessarily about the initial rate as it is about the evolution of those rates, which would mean those are the ones that required updated or new detections in any given vendor.
Analysis
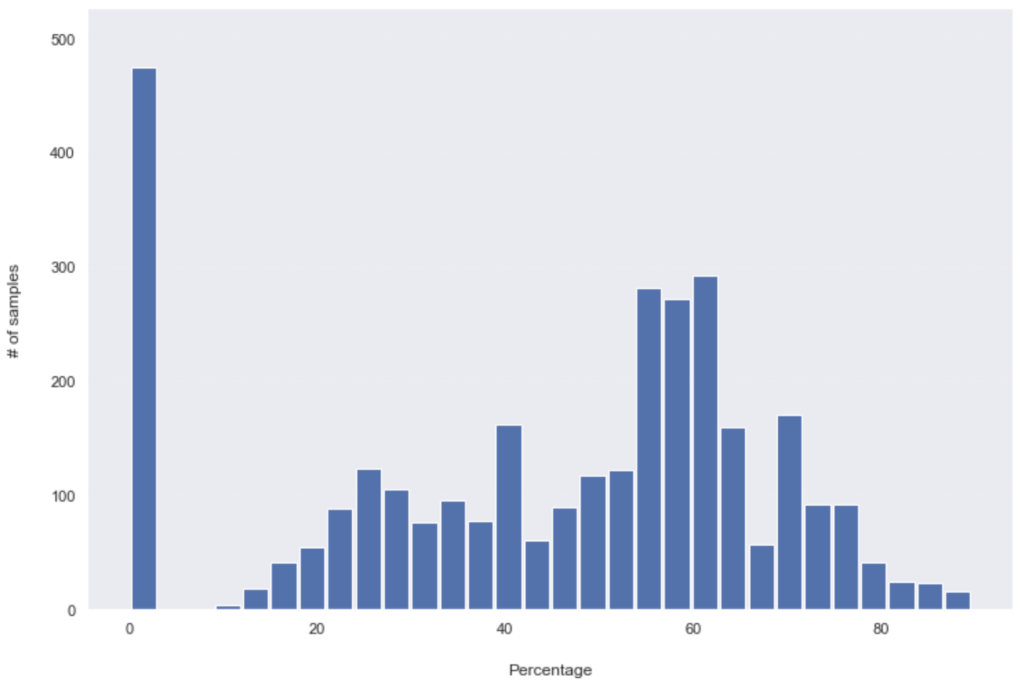
I collected this set from ThreatConnect on 28-10-2020 with the following query: typeName in ("File") and indicatorActive = true and confidence > 70 and dateAdded = "10-28-2020". These are unique and newly created hashes (on the same day, on that platform – they might have been previously seen elsewhere). The dataset had 3236 hashes, which were then sent to a multi-AV engine and it shows the following detection rates:
Detection rates on 28-10:
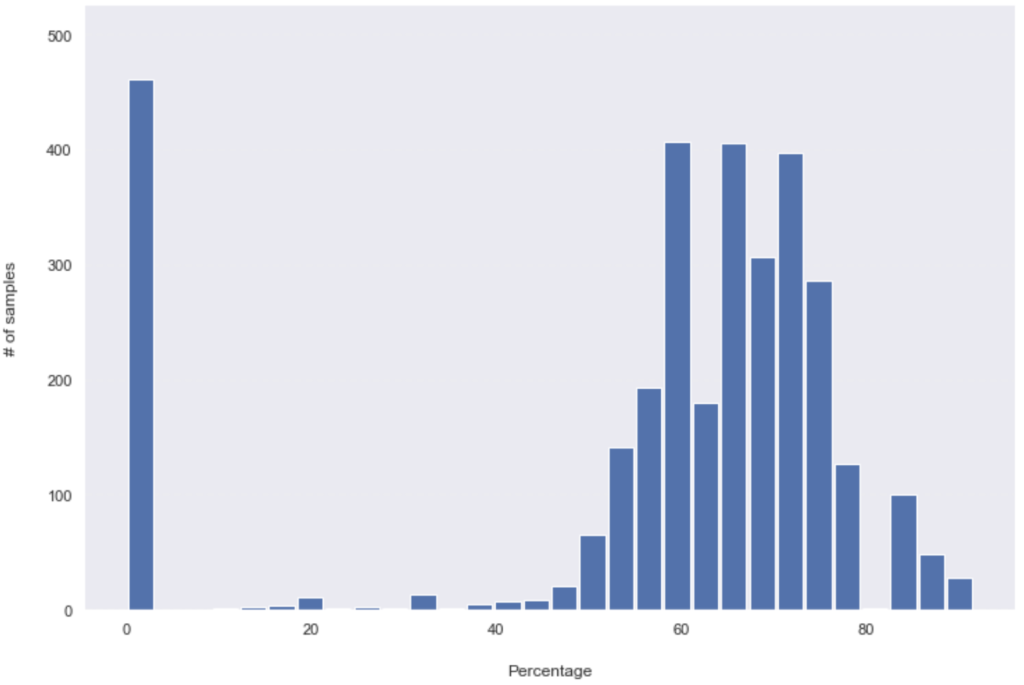
Detection rates on 29-10:
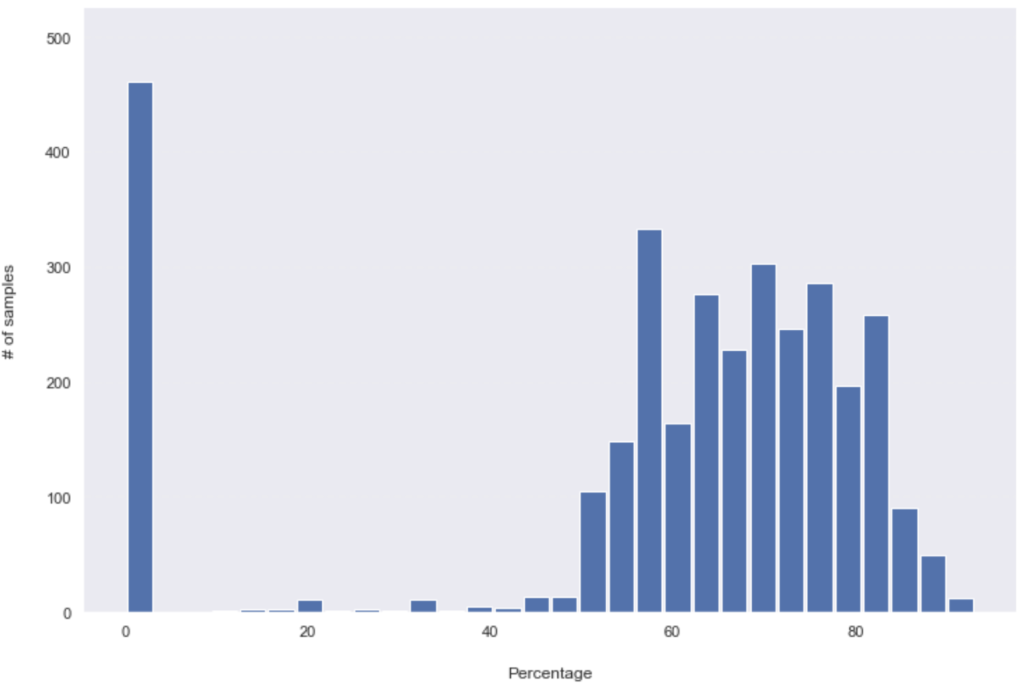
Detection rates on 30-10 (Friday):
Detection rates on 02-11 (Monday):
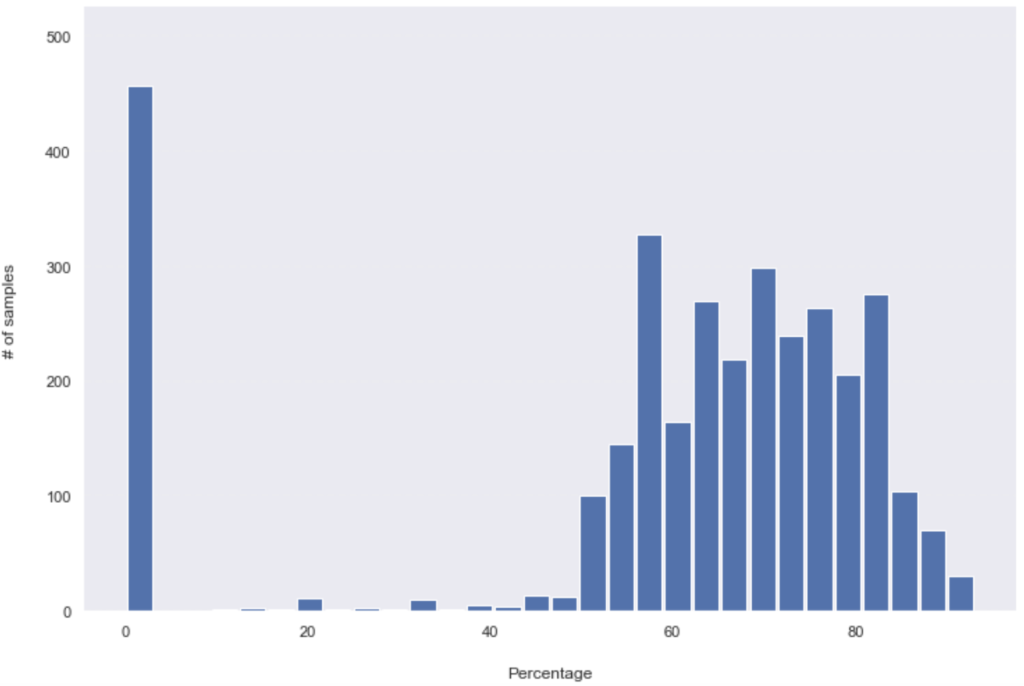
A very noticeable change happened in the first 24hours; more than 730 samples (hashes) went from being detected by only between 12.5% to 40%, to more than 60% of the security products overnight. Overall, almost half of the dataset (49.13% – 1590 hashes out of 3236) has seen added detections in the first 24hours. The change after that was slower, although, in the next 24hours, another 414 hashes have seen an increase in their detection rate. That dropped to only 160 samples/ added detections in the following 72hours period (which includes the weekend). What you might have noticed as well is the important number of unknown hashes (with zero detections), which only changed by 18 in the entire tested period. Those 18 (out of 475) hashes went from unknown to being detected by 52% to 90% of all security solutions.
Now, not all solutions are created equal. In terms of individual performance of each product, measured by the number of added detections over time, the following boxplot shows quite a large disparity across products (18 security products are represented here). It has a rather high median of over 400 samples that needed either updating or new detections in that period. These aren’t great numbers, but nothing surprising there if I’m being honest. In many cases, complex attacks and samples may take days (or even weeks and months) to be fully analyzed. And this is only the tip of the iceberg; these files are available on a threat intelligence platform (with a rather high threat rating) and yet thousands are still missed by security solutions. In times where file-based threats are not even the most relevant ones, this is worrying! The good news, however, is that certain products seem to be way more reactive than others (one of the products had an initial 84% detection rate, for known samples, and added updates for only 25 samples in the tested period).
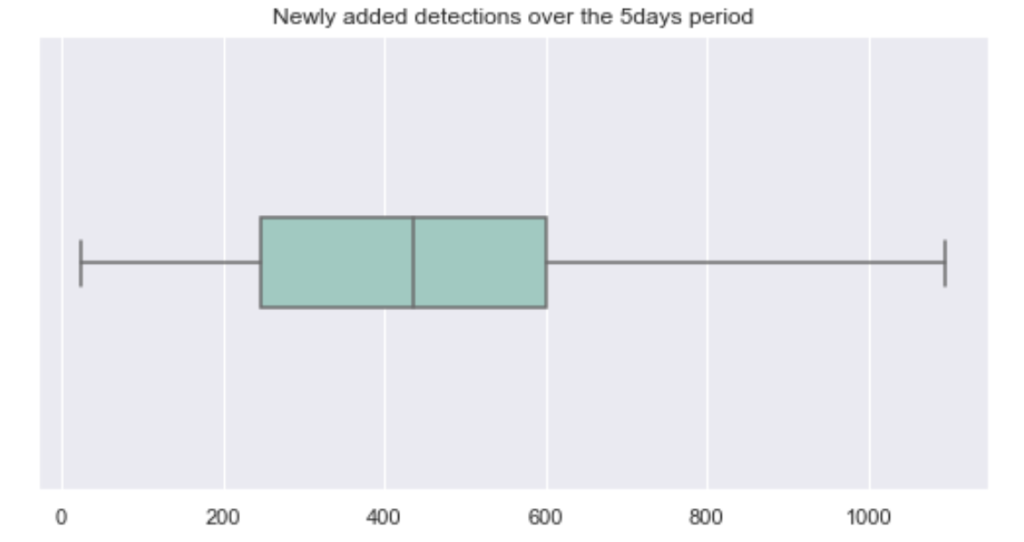
A major caveat to this analysis is that the settings of the security solutions on the multi-AV platform is unknown. Nevertheless, this lag in detections is a clear sign of the struggle and ongoing asymmetry in cybersecurity. The attackers change and adapt way much faster than defenders, which, more often than not, look like easy and slow-moving targets. I believe the answer to the question in the title is rather clear. Going forward, with the explosion of the attack surface and lack of investment in skills and innovative solutions, this might even get worse.